
PROJECT: SERVICE MAP
research > ideation > prototyping > implementation
Project context
-
Research told us that consumers often struggle with similar or related issues as they navigated throughout our experience. We wanted a way to document and ideally see where opportunities to align user expectations and improve upon the same problem throughout the experience.
-
6 designers from 6 teams - all working on the same service, my role = project manager, workshop and deliverable facilitator
I led the project proposal, facilitated the discovery sprint and collaboration with stakeholders.
-
Visually describe the consumer experience
Plot data points (issues, metrics, systems, etc.) associated with the product they relate to
Provide connected details (expand, link, etc.) for more information about that data point
Shareable / usable export format that doesn’t require downloads to view & use
FedRAMP certified
-
Confluence, Miro/Mural, Lucidchart, Google Sheets
-
October 2020 - June 2021
October 17 - 30, 2020. Define and build a first draft service map.
What are we trying to solve, inspiration, define the work to be done, map first draft, refine the map, add data points, tie it together, draft complete.
January 1 - 21, 2021. Review and use the map to facilitate conversations future work.
January 21 - February 3, 2021. Update data points.
The map was updated with additional findings from the research report, any data points we’ve addressed since the last updated, and made any other changes as needed.
March 18 -31, 2021. Export map from Miro and transition map to Confluence.
May 13 -26, 2021. Update data points.
The teams updated the map again with earlier work done, as well as any other updates.
May 27 - June 9, 2021. Identify a new tool.
A small work group worked to identify a new tool to host the service map, in order to continue working toward its long-term goals.
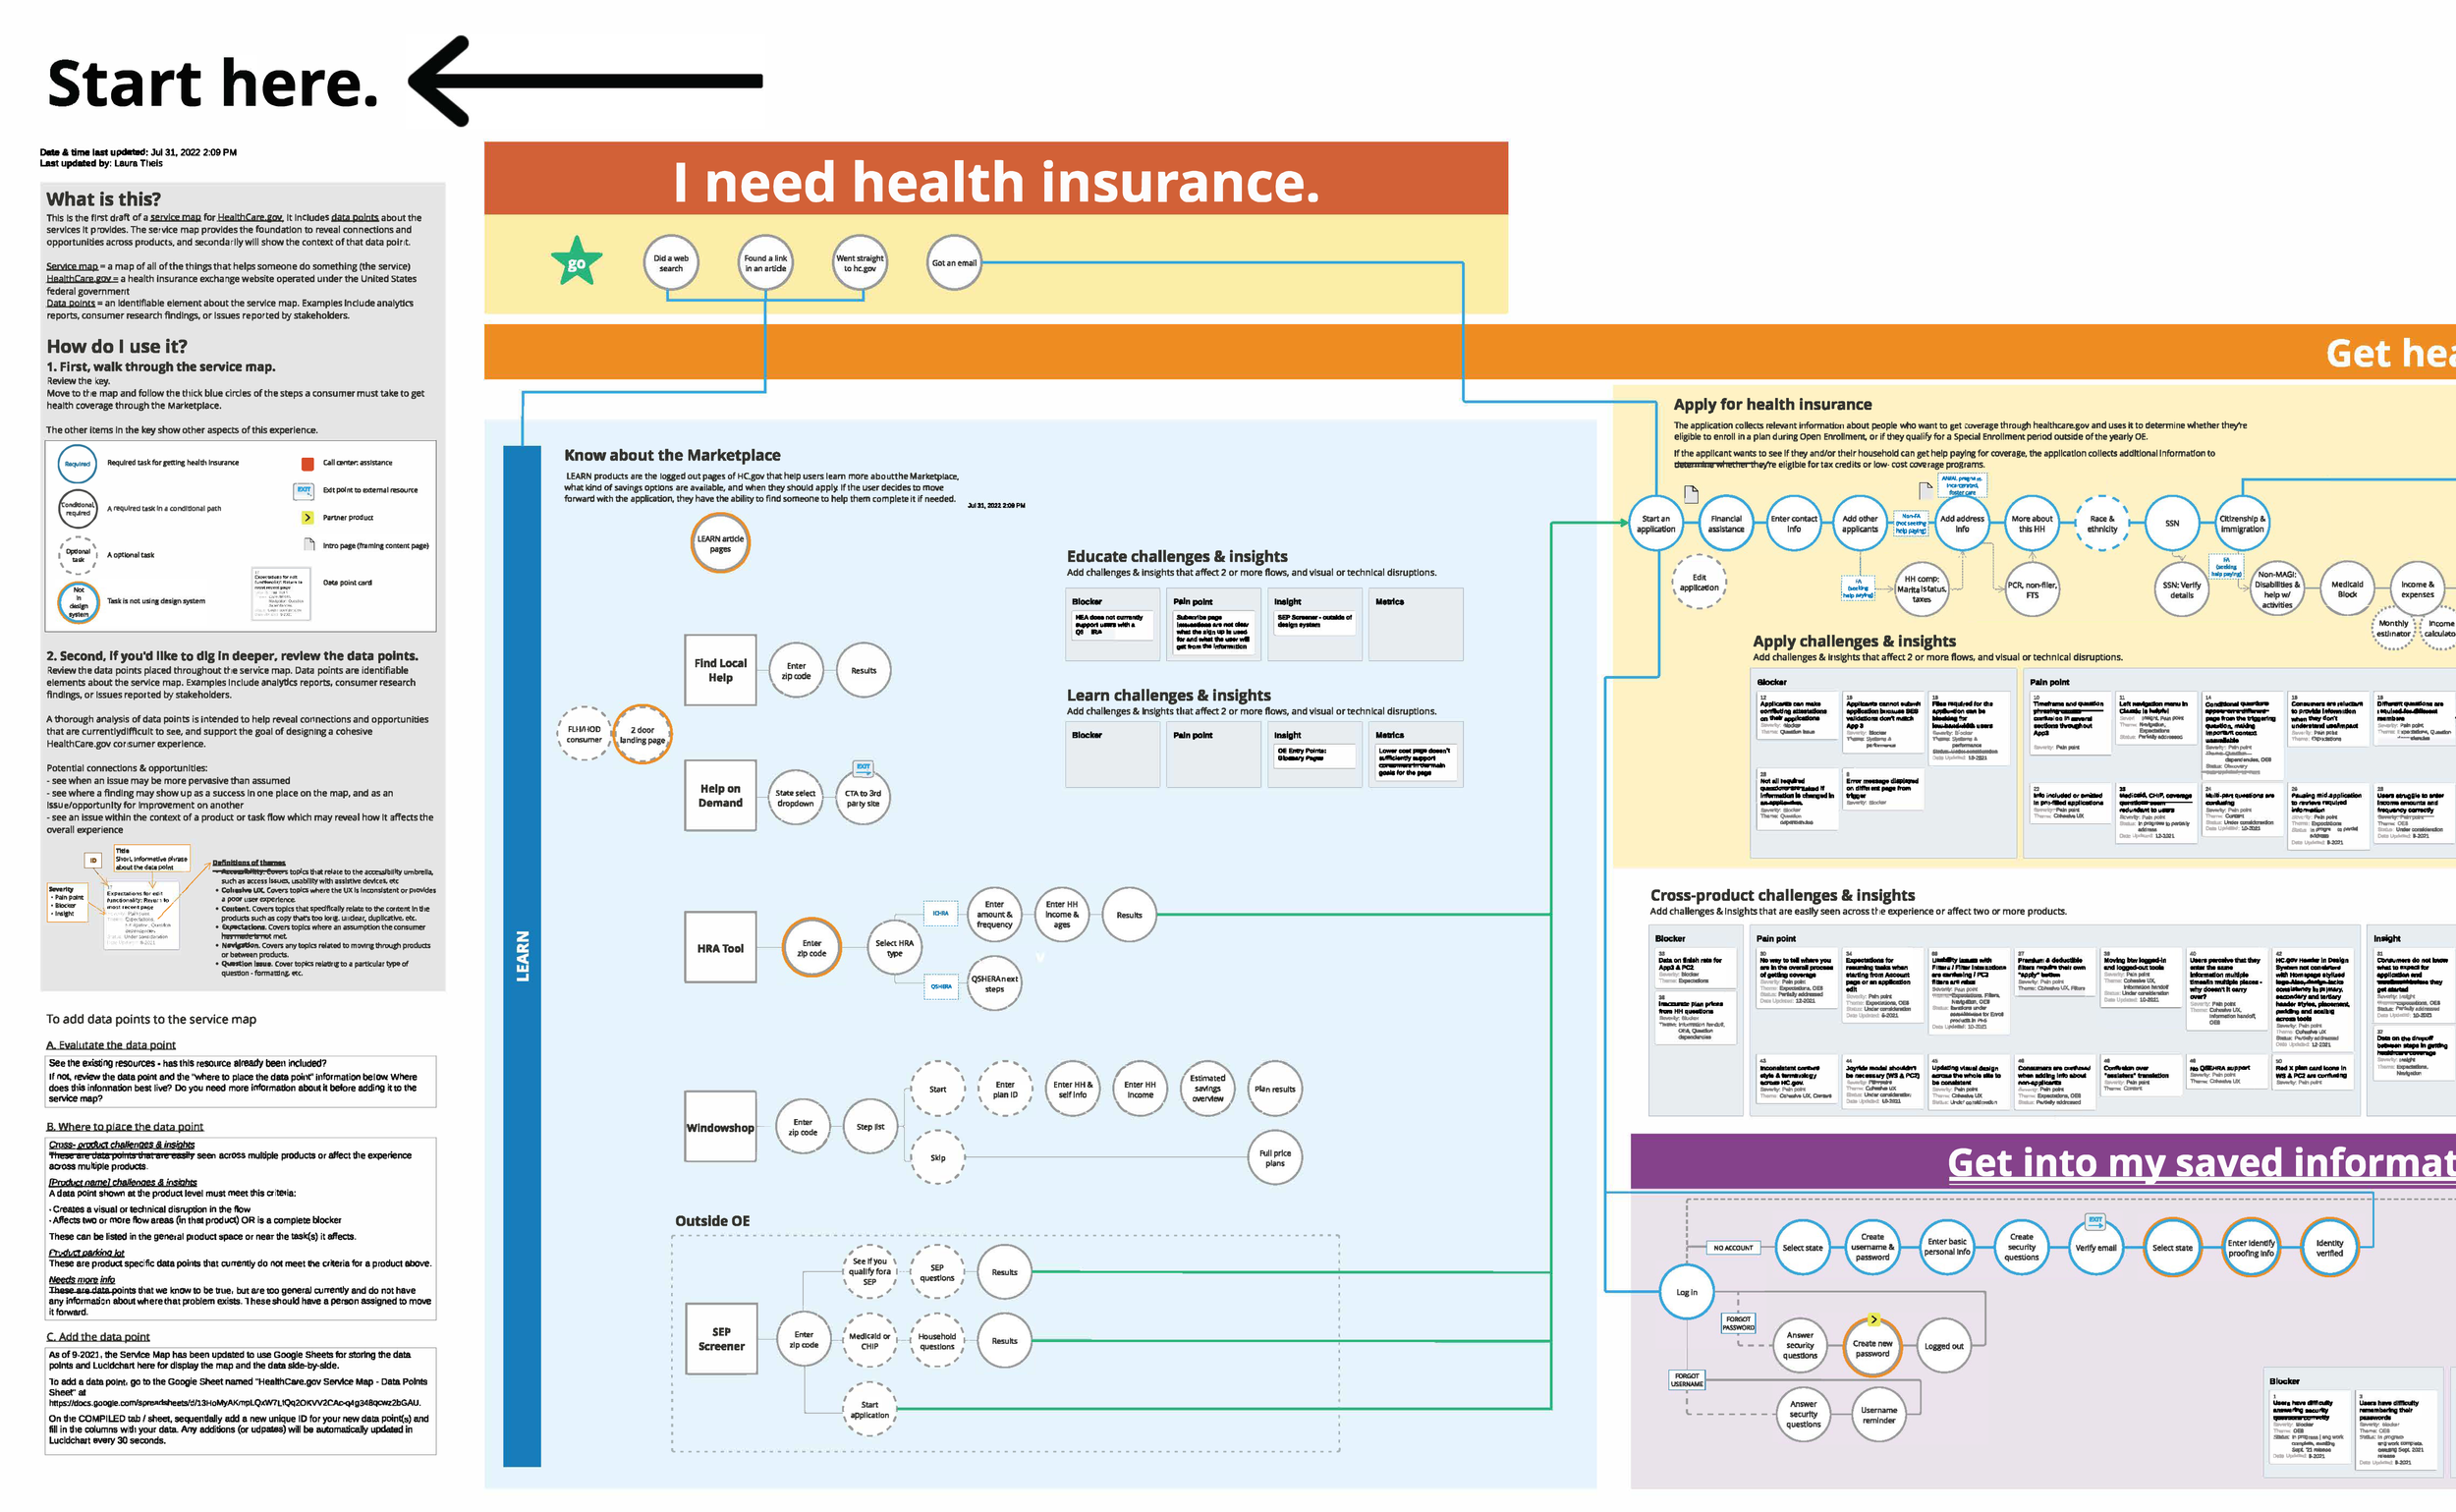
High level overview of service map
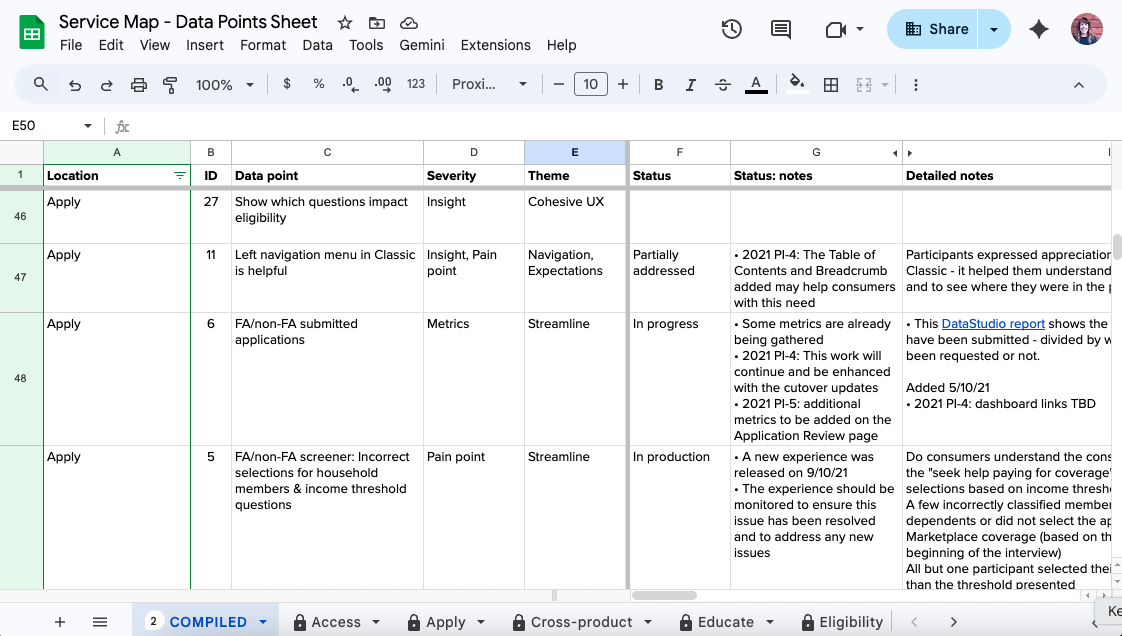
Snapshot of the Google sheet of the data points that support the service map
The story
Background
It began with a work book club and worked to bring together our teams, providing a single service for the American public. Our design practice read Good Services by Lou Downe, and a light bulb moment happened for so many of our team. As our product matures, this is exactly the tool we need to pull our teams and the experience together.
Research told us that consumers often struggle with similar or related issues as they navigated throughout our experience - learning about healthcare, applying for coverage and choosing plans.
The current approach was that the focus on each individual step of the process as that opportunities to identify times when solutions aren’t uniformly successfully across products, or when the same problem manifests in different places throughout the user experience.
“The only person who gets to decide what the service is, is the person who has the goal they need to achieve - and that’s your user. It’s your job to orchestrate all of the pieces this service in as seamless a journey as possible, even if you don’t provide the whole service yourself.” pg. 27, Good Services, Lou Downe
Take an experience that the consumer sees as all as a single experience and unify the teams running the services behind the scenes
My role
during the initial build: key facilitator and planning assignments to complete the tasks
after the initial build:
instigate and require regular updates to the map
key planner and researcher on further tools to use
Current status
Archived. While our team had the contract for these services, the map was updated every couple of months to see what options for alignment still exist and what issues we’ve been able to make inroads on. After the contract transferred to another vendor, the map is no longer in use.
Project Retrospective
The project is on-going so helpful to think about long-term goals
Keep the service map relevant (that may mean as we’re currently using it, or folding it into other initiatives)
Provide value from the map - new initiatives, things we would have been able to see otherwise
What went well?
We saw a opportunity, advocated for discovery and phase 1 build-out, even though we weren’t sure what would come out of this work.
Significant input of time from all teams at the start of the project. The cross-team element meant that all teams’ views were important and it was very helpful to have time from everyone during that discovery and decision making. Lots of time from all teams also meant that we were able to complete a lot of work in a short amount of time.
What can be improved?
Without organizational structure or prioritization behind an idea, it becomes the work of a single champion to make sure it keeps moving forward. With that in mind, if an idea is one that will need time to become part of regular use, build in long-term capacity for continued work.
What did I learn?
The deliverable isn’t always the most important part of a project. For this work, the time together as a team, to initiate the sharing cycles and put the cross-team collaboration at the front of everyone’s mind was a very positive outcome of this work.